One possible solution
Before we start
We don’t have to follow this line by line but it’s important to study this example well before demonstrating this.
Emphasize that the example is Python but we will try to see “through” the code and focus on the bigger picture and hopefully manage to imagine other languages in its place.
We collect ideas and feedback in the collaborative document while coding and the instructor tries to react to that without going into the rabbit hole.
Learners can also explore some of these steps in one of the exercise sessions.
Checklist
Start with notebook
Generalize from January to also February and March data
Abstract code into functions
Move from notebook to script
From functions with side-effects towards stateless functions
Initialize git
Add
requirements.txtAdd test (optional)
Add command line interface
Show how a workflow solution could look
Split into multiple files/modules
Our initial version
The initial version of our script for this exercise plots a series of temperatures and precipitations for January as well as the mean temperature averaged over the month. Suppose that we assemble a working script from various internet research/AI chat recommendations and arrive at:
import pandas as pd
import matplotlib.pyplot as plt


# read data
data = pd.read_csv("weather_data.csv")

# combine 'date' and 'time' into a single column 'recorded_at' as type datetime
data["recorded_at"] = pd.to_datetime(data["date"] + " " + data["time"])

# set 'recorded_at' as index for convenience
data = data.set_index("recorded_at")

# keep only january data using datetime period indexing
january = data.loc["2024-01"]

fig, ax = plt.subplots()

# temperature time series
ax.plot(
    january.index,
    january["air_temperature_celsius"],
    label="air temperature (C)",
    color="red",
)

values = january["air_temperature_celsius"].values
mean_temp = sum(values) / len(values)

# mean temperature (as horizontal dashed line)
ax.axhline(
    y=mean_temp,
    label=f"mean air temperature (C): {mean_temp:.1f}",
    color="red",
    linestyle="--",
)

ax.set_title("air temperature (C) at Helsinki airport")
ax.set_xlabel("date and time")
ax.set_ylabel("air temperature (C)")
ax.legend()
ax.grid(True)

# format x-axis for better date display
fig.autofmt_xdate()

fig.savefig("2024-01-temperature.png")

fig, ax = plt.subplots()

# precipitation time series
ax.plot(
    january.index,
    january["precipitation_mm"],
    label="precipitation (mm)",
    color="blue",
)

ax.set_title("precipitation (mm) at Helsinki airport")
ax.set_xlabel("date and time")
ax.set_ylabel("precipitation (mm)")
ax.legend()
ax.grid(True)

# format x-axis for better date display
fig.autofmt_xdate()

fig.savefig("2024-01-precipitation.png")
Work in progress. You can help us by contributing or improving an R solution.
We test it out in a notebook.
Plotting also February and March data
Copy-pasting very similar code 6 times would be too complicated to maintain.
We avoid this by iterating over the first 3 months.
Instead of reusing
data, we introducedata_month.
import pandas as pd
import matplotlib.pyplot as plt


# read data
data = pd.read_csv("weather_data.csv")

# combine 'date' and 'time' into a single column 'recorded_at' as type datetime
data["recorded_at"] = pd.to_datetime(data["date"] + " " + data["time"])

# set 'recorded_at' as index for convenience
data = data.set_index("recorded_at")

for month in ["2024-01", "2024-02", "2024-03"]:
    data_month = data.loc[month]

    fig, ax = plt.subplots()

    # temperature time series
    ax.plot(
        data_month.index,
        data_month["air_temperature_celsius"],
        label="air temperature (C)",
        color="red",
    )

    values = data_month["air_temperature_celsius"].values
    mean_temp = sum(values) / len(values)

    # mean temperature (as horizontal dashed line)
    ax.axhline(
        y=mean_temp,
        label=f"mean air temperature (C): {mean_temp:.1f}",
        color="red",
        linestyle="--",
    )

    ax.set_title("air temperature (C) at Helsinki airport")
    ax.set_xlabel("date and time")
    ax.set_ylabel("air temperature (C)")
    ax.legend()
    ax.grid(True)

    # format x-axis for better date display
    fig.autofmt_xdate()

    fig.savefig(f"{month}-temperature.png")

    fig, ax = plt.subplots()

    # precipitation time series
    ax.plot(
        data_month.index,
        data_month["precipitation_mm"],
        label="precipitation (mm)",
        color="blue",
    )

    ax.set_title("precipitation (mm) at Helsinki airport")
    ax.set_xlabel("date and time")
    ax.set_ylabel("precipitation (mm)")
    ax.legend()
    ax.grid(True)

    # format x-axis for better date display
    fig.autofmt_xdate()

    fig.savefig(f"{month}-precipitation.png")
Work in progress. You can help us by contributing or improving an R solution.
Abstracting the plotting part into a function
import pandas as pd
import matplotlib.pyplot as plt


def plot(column, label, location, color, compute_mean):
    fig, ax = plt.subplots()

    # time series
    ax.plot(
        data_month.index,
        data_month[column],
        label=label,
        color=color,
    )

    if compute_mean:
        values = data_month[column].values
        mean_value = sum(values) / len(values)

        # mean (as horizontal dashed line)
        ax.axhline(
            y=mean_value,
            label=f"mean {label}: {mean_value:.1f}",
            color=color,
            linestyle="--",
        )

    ax.set_title(f"{label} at {location}")
    ax.set_xlabel("date and time")
    ax.set_ylabel(label)
    ax.legend()
    ax.grid(True)

    # format x-axis for better date display
    fig.autofmt_xdate()

    fig.savefig(f"{month}-{column}.png")


# read data
data = pd.read_csv("weather_data.csv")

# combine 'date' and 'time' into a single column 'recorded_at' as type datetime
data["recorded_at"] = pd.to_datetime(data["date"] + " " + data["time"])

# set 'recorded_at' as index for convenience
data = data.set_index("recorded_at")


for month in ["2024-01", "2024-02", "2024-03"]:
    data_month = data.loc[month]

    plot(
        "air_temperature_celsius",
        "air temperature (C)",
        "Helsinki airport",
        "red",
        compute_mean=True,
    )
    plot(
        "precipitation_mm",
        "precipitation (mm)",
        "Helsinki airport",
        "blue",
        compute_mean=False,
    )
Work in progress. You can help us by contributing or improving an R solution.
Discuss the advantages of what we have done here.
Discuss what we expect before running it (we might expect this not to work because
data_monthseems undefined inside the function).Then try it out (it actually works).
Discuss problems with this solution (what if we copy-paste the function to a different file?).
The point of this step was that abstracting code into functions can be really good for re-usability but just the fact that we created a function does not mean that the function is reusable since in this case it depends on a variable defined outside the function and hence there are side-effects.
Small improvements
Abstracting into more functions.
Notice how some code comments got redundant:
import pandas as pd
import matplotlib.pyplot as plt


def read_data(file_name):
    data = pd.read_csv(file_name)

    # combine 'date' and 'time' into a single column 'recorded_at' as type datetime
    data["recorded_at"] = pd.to_datetime(data["date"] + " " + data["time"])

    # set 'recorded_at' as index for convenience
    data = data.set_index("recorded_at")

    return data


def arithmetic_mean(values):
    mean_value = sum(values) / len(values)
    return mean_value


def plot(column, label, location, color, compute_mean):
    fig, ax = plt.subplots()

    # time series
    ax.plot(
        data_month.index,
        data_month[column],
        label=label,
        color=color,
    )

    if compute_mean:
        mean_value = arithmetic_mean(data_month[column].values)

        # mean (as horizontal dashed line)
        ax.axhline(
            y=mean_value,
            label=f"mean {label}: {mean_value:.1f}",
            color=color,
            linestyle="--",
        )

    ax.set_title(f"{label} at {location}")
    ax.set_xlabel("date and time")
    ax.set_ylabel(label)
    ax.legend()
    ax.grid(True)

    # format x-axis for better date display
    fig.autofmt_xdate()

    fig.savefig(f"{month}-{column}.png")


data = read_data("weather_data.csv")

for month in ["2024-01", "2024-02", "2024-03"]:
    data_month = data.loc[month]

    plot(
        "air_temperature_celsius",
        "air temperature (C)",
        "Helsinki airport",
        "red",
        compute_mean=True,
    )
    plot(
        "precipitation_mm",
        "precipitation (mm)",
        "Helsinki airport",
        "blue",
        compute_mean=False,
    )
Work in progress. You can help us by contributing or improving an R solution.
Discuss what would happen if we copy-paste the functions to another project (these functions are stateful/time-dependent).
Emphasize how stateful functions and order of execution in Jupyter notebooks can produce unexpected results and explain why we motivate to rerun all cells before sharing the notebook.
Move from notebook to script
“File” -> “Save and Export Notebook As …” -> “Executable Script”
git initand commit the working version.Add
requirements.txtand motivate how that can be useful to have later.
As we continue from here, create commits after meaningful changes and later also share the repository with learners. This nicely connects to other lessons of the workshop.
Towards functions without side-effects
In Python we can detect problems by encapsulating all code into functions and when using a code editor with a static checker (instructor can demonstrate this by first introducing a main function, then detecting problems, then fixing the problems):
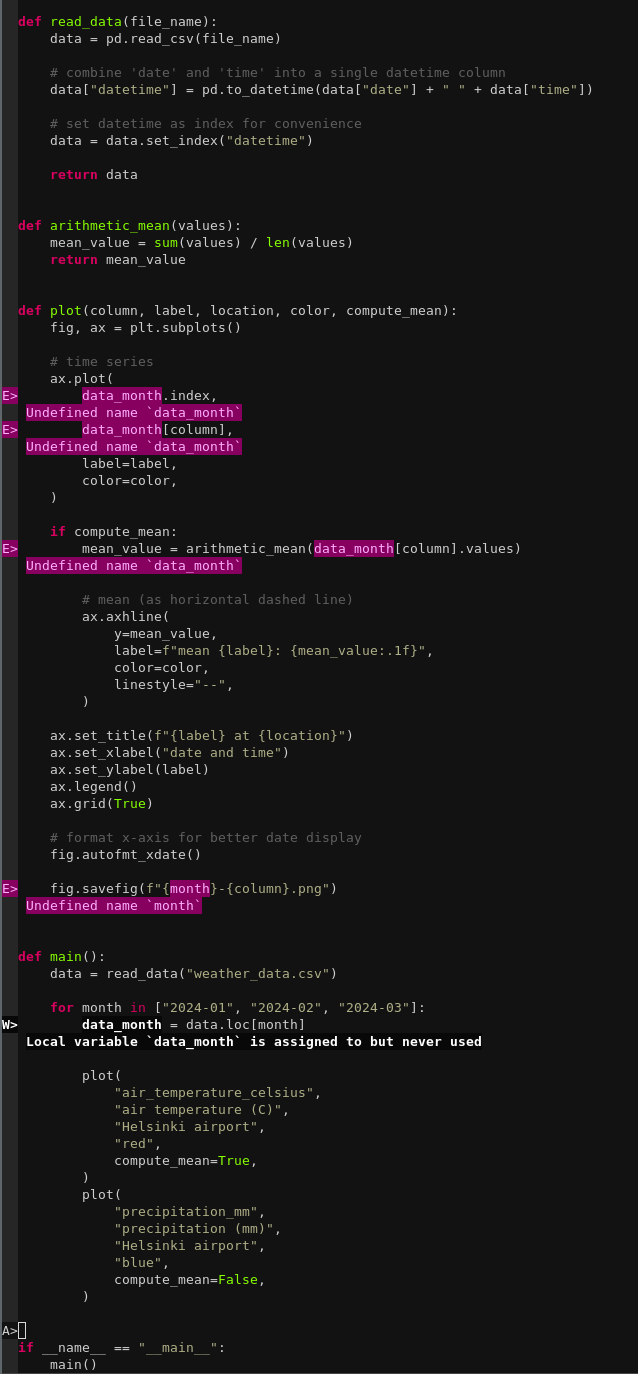
After we have tucked the “main” code under a main function, an editor with linter/checker enabled highlights undefined names and variables which are assigned but never used. The screenshot was obtained from a vim editor with ruff language server enabled.
We then improve towards:
import pandas as pd
import matplotlib.pyplot as plt


def read_data(file_name):
    data = pd.read_csv(file_name)

    # combine 'date' and 'time' into a single column 'recorded_at' as type datetime
    data["recorded_at"] = pd.to_datetime(data["date"] + " " + data["time"])

    # set 'recorded_at' as index for convenience
    data = data.set_index("recorded_at")

    return data


def arithmetic_mean(values):
    mean_value = sum(values) / len(values)
    return mean_value


def plot(date_range, values, label, location, color, compute_mean, file_name):
    fig, ax = plt.subplots()

    # time series
    ax.plot(
        date_range,
        values,
        label=label,
        color=color,
    )

    if compute_mean:
        mean_value = arithmetic_mean(values)

        # mean (as horizontal dashed line)
        ax.axhline(
            y=mean_value,
            label=f"mean {label}: {mean_value:.1f}",
            color=color,
            linestyle="--",
        )

    ax.set_title(f"{label} at {location}")
    ax.set_xlabel("date and time")
    ax.set_ylabel(label)
    ax.legend()
    ax.grid(True)

    # format x-axis for better date display
    fig.autofmt_xdate()

    fig.savefig(file_name)


def main():
    data = read_data("weather_data.csv")

    for month in ["2024-01", "2024-02", "2024-03"]:
        data_month = data.loc[month]
        date_range = data_month.index

        plot(
            date_range,
            data_month["air_temperature_celsius"].values,
            "air temperature (C)",
            "Helsinki airport",
            "red",
            compute_mean=True,
            file_name=f"{month}-temperature.png",
        )
        plot(
            date_range,
            data_month["precipitation_mm"].values,
            "precipitation (mm)",
            "Helsinki airport",
            "blue",
            compute_mean=False,
            file_name=f"{month}-precipitation.png",
        )


if __name__ == "__main__":
    main()
Work in progress. You can help us by contributing or improving an R solution.
These functions can now be copy-pasted to a different notebook or project and they will still work.
Unit tests (optional)
In this section we look at how to apply the testing lesson to this example.
Discuss what one could mean with “design code for testing”.
Discuss when to test and when not to test.
Discuss where to add a test and add a test to the
arithmetic_meanfunction:
import pandas as pd
import matplotlib.pyplot as plt
import pytest


def read_data(file_name):
    data = pd.read_csv(file_name)

    # combine 'date' and 'time' into a single column 'recorded_at' as type datetime
    data["recorded_at"] = pd.to_datetime(data["date"] + " " + data["time"])

    # set 'recorded_at' as index for convenience
    data = data.set_index("recorded_at")

    return data


def arithmetic_mean(values):
    mean_value = sum(values) / len(values)
    return mean_value


def test_arithmetic_mean():
    result = arithmetic_mean([1.0, 2.0, 3.0, 4.0])
    assert result == pytest.approx(2.5)


def plot(date_range, values, label, location, color, compute_mean, file_name):
    fig, ax = plt.subplots()

    # time series
    ax.plot(
        date_range,
        values,
        label=label,
        color=color,
    )

    if compute_mean:
        mean_value = arithmetic_mean(values)

        # mean (as horizontal dashed line)
        ax.axhline(
            y=mean_value,
            label=f"mean {label}: {mean_value:.1f}",
            color=color,
            linestyle="--",
        )

    ax.set_title(f"{label} at {location}")
    ax.set_xlabel("date and time")
    ax.set_ylabel(label)
    ax.legend()
    ax.grid(True)

    # format x-axis for better date display
    fig.autofmt_xdate()

    fig.savefig(file_name)


def main():
    data = read_data("weather_data.csv")

    for month in ["2024-01", "2024-02", "2024-03"]:
        data_month = data.loc[month]
        date_range = data_month.index

        plot(
            date_range,
            data_month["air_temperature_celsius"].values,
            "air temperature (C)",
            "Helsinki airport",
            "red",
            compute_mean=True,
            file_name=f"{month}-temperature.png",
        )
        plot(
            date_range,
            data_month["precipitation_mm"].values,
            "precipitation (mm)",
            "Helsinki airport",
            "blue",
            compute_mean=False,
            file_name=f"{month}-precipitation.png",
        )


if __name__ == "__main__":
    main()
Work in progress. You can help us by contributing or improving an R solution.
Command-line interface (CLI)
Add a CLI for the input data file, the month, and the output folder.
Instructor demonstrates it, for instance:
$ python example.py --month 2024-05 --data-file weather_data.csv --output-directory /home/user/example/results
Example here is using click but it can equally well be optparse, argparse, docopt, or Typer.
Discuss the motivations for adding a CLI:
We are able to modify the behavior without changing (or needing to understand) the code
We can run many of such scripts as part of a workflow
from pathlib import Path


import pandas as pd
import matplotlib.pyplot as plt
import pytest
import click


def read_data(file_name):
    data = pd.read_csv(file_name)

    # combine 'date' and 'time' into a single column 'recorded_at' as type datetime
    data["recorded_at"] = pd.to_datetime(data["date"] + " " + data["time"])

    # set 'recorded_at' as index for convenience
    data = data.set_index("recorded_at")

    return data


def arithmetic_mean(values):
    mean_value = sum(values) / len(values)
    return mean_value


def test_arithmetic_mean():
    result = arithmetic_mean([1.0, 2.0, 3.0, 4.0])
    assert result == pytest.approx(2.5)


def plot(date_range, values, label, location, color, compute_mean, file_name):
    fig, ax = plt.subplots()

    # time series
    ax.plot(
        date_range,
        values,
        label=label,
        color=color,
    )

    if compute_mean:
        mean_value = arithmetic_mean(values)

        # mean (as horizontal dashed line)
        ax.axhline(
            y=mean_value,
            label=f"mean {label}: {mean_value:.1f}",
            color=color,
            linestyle="--",
        )

    ax.set_title(f"{label} at {location}")
    ax.set_xlabel("date and time")
    ax.set_ylabel(label)
    ax.legend()
    ax.grid(True)

    # format x-axis for better date display
    fig.autofmt_xdate()

    fig.savefig(file_name)


@click.command()
@click.option("--month", required=True, type=str, help="Which month (YYYY-MM)?")
@click.option(
    "--data-file",
    required=True,
    type=click.Path(exists=True, path_type=Path),
    help="Data is read from this file.",
)
@click.option(
    "--output-directory",
    required=True,
    type=click.Path(exists=True, path_type=Path),
    help="Figures are written to this directory.",
)
def main(
    month,
    data_file,
    output_directory,
):
    data = read_data(data_file)

    data_month = data.loc[month]
    date_range = data_month.index

    plot(
        date_range,
        data_month["air_temperature_celsius"].values,
        "air temperature (C)",
        "Helsinki airport",
        "red",
        compute_mean=True,
        file_name=output_directory / f"{month}-temperature.png",
    )
    plot(
        date_range,
        data_month["precipitation_mm"].values,
        "precipitation (mm)",
        "Helsinki airport",
        "blue",
        compute_mean=False,
        file_name=output_directory / f"{month}-precipitation.png",
    )


if __name__ == "__main__":
    main()
Work in progress. You can help us by contributing or improving an R solution.
Split long script into modules
Discuss how you would move some functions out and organize them into separate modules which can be imported to other projects.
Discuss naming.
Discuss interface design.
Summarize in the collaborative document
Now return to initial questions on the collaborative document and discuss questions and comments. If there is time left, there are additional questions and exercises.
It is easier and more fun to teach this as a pair with somebody else where one person can type and the other person helps watching the questions and commends and relays them to the co-instructor.