Jupyter Notebooks
Objectives
Know what it is
Create a new notebook and save it
Open existing notebooks from the web
Be able to create text/markdown cells, code cells, images, and equations
Know when to use a Jupyter Notebook for a Python project and when perhaps not to
We will build up this notebook (spoiler alert!)
[this lesson is adapted from https://coderefinery.github.io/jupyter/motivation/]
Motivation for Jupyter Notebooks

One of the first notebooks: Galileo’s drawings of Jupiter and its Medicean Stars from Sidereus Nuncius. Image courtesy of the History of Science Collections, University of Oklahoma Libraries (CC-BY).
Code, text, equations, figures, plots, etc. are interleaved, creating a computational narrative.
The name “Jupyter” derives from Julia+Python+R, but today Jupyter kernels exist for dozens of programming languages.
Our first notebook
Exercise Jupyter-1: Create a notebook (15 min)
Open a new notebook (on Windows: open Anaconda Navigator, then launch JupyterLab; on macOS/Linux: you can open JupyterLab from the terminal by typing
jupyter-lab)Rename the notebook
Create a markdown cell with a section title, a short text, an image, and an equation
# Title of my notebook Some text.  $E = mc^2$
Most important shortcut: Shift + Enter, to run current cell and create a new one below.
Create a code cell where you define the
arithmetic_meanfunction:def arithmetic_mean(sequence): s = 0.0 for element in sequence: s += element n = len(sequence) return s / n
In a different cell, call the function:
arithmetic_mean([1, 2, 3, 4, 5])
In a new cell, let us try to plot a layered histogram. Note: as a beginner you might be struggling to understand what is going on at this stage compared to the previous simple examples. This is to show you that a good starting point is to copy pasting code from tutorials to see if you can re-run them locally, and then proceed to understand the code and try some changes.
# this example is from https://altair-viz.github.io/gallery/layered_histogram.html

import pandas as pd
import altair as alt
import numpy as np
np.random.seed(42)

# Generating Data
source = pd.DataFrame({
    'Trial A': np.random.normal(0, 0.8, 1000),
    'Trial B': np.random.normal(-2, 1, 1000),
    'Trial C': np.random.normal(3, 2, 1000)
})

alt.Chart(source).transform_fold(
    ['Trial A', 'Trial B', 'Trial C'],
    as_=['Experiment', 'Measurement']
).mark_bar(
    opacity=0.3,
    binSpacing=0
).encode(
    alt.X('Measurement:Q').bin(maxbins=100),
    alt.Y('count()').stack(None),
    alt.Color('Experiment:N')
)
Run all cells.
Save the notebook.
Observe that a “#” character has a different meaning in a code cell (code comment) than in a markdown cell (heading).
Your notebook should look like this one.
Note
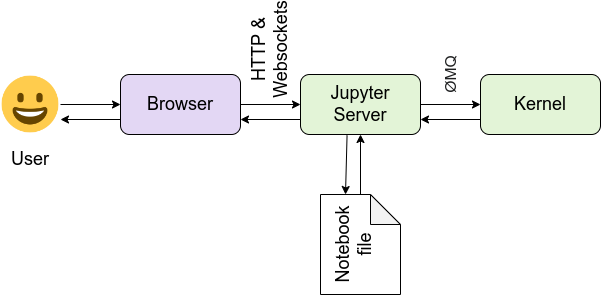
Understanding the Jupyter architecture
It is important to understand how Jupyter Notebooks work behind the scenes. Here’s a simple way to think about it:
Think of it like a kitchen:
You (the user) are the chef — deciding what you want to cook (analyze), and writing down the recipe.
The browser is your fancy recipe notebook interface, where you write, update, and view your instructions.
The Jupyter server is the kitchen manager — it organizes everything, coordinates requests, and keeps track of the pots, pans, and ingredients.
The kernel is a robotic cook operating the stove. It follows your instructions, grabs the ingredients, prepares the dishes, and sends them back to your notebook — this is the part that actually runs your code.
The notebook file (
.ipynb) is the recipe sheet, storing everything: code, instructions, outputs, and notes — so you (or others) can reproduce the results later.
Together, this setup allows you to write code, execute it, and see results — all in one place!
This is a simplified view — in practice, the Jupyter architecture can be extended with multiple users, remote kernels, and more. See the full architecture documentation at https://docs.jupyter.org/en/latest/projects/architecture/content-architecture.html
Use cases for notebooks
Really good for step-by-step recipes (e.g. read data, filter data, do some statistics, plot the results)
Experimenting with new ideas, testing new libraries/databases
As an interactive development environment for code, data analysis, and visualization
Keeping track of interactive sessions, like a digital lab notebook
Supplementary information with published articles
Good practices
Run all cells or even Restart Kernel and Run All Cells before sharing/saving to verify that the results you see on your computer were not due to cells being run out of order.
This can be demonstrated with the following example:
numbers = [1, 2, 3, 4, 5]
arithmetic_mean(numbers)
We can first split this code into two cells and then re-define numbers
further down in the notebook. If we run the cells out of order, the result will
be different.
Limitations of notebooks
(Read more at Pitfalls of Jupyter Notebooks.)
You can run cells in any order, which may lead to confusing or incorrect results if you’re not careful.
Variables stay in memory even if you delete the cell that created them — this can lead to surprises!
Hard to know what’s been run and in what order unless you restart the kernel and run all cells.
Notebooks don’t always work well with version control (like Git) because output cells can make the files messy.
Mixing too much text, code, and results can make notebooks hard to read or maintain if they get too long.
Notebooks aren’t ideal for building reusable scripts, libraries, or production code — they are more for exploration.
If you’re using notebooks for more than quick experiments or interactive work, it’s good to be aware of these limitations — and consider moving parts of your workflow to regular .py files when needed.
Keypoints
Jupyter Notebooks combine code, text, plots, and results in one document: ideal for interactive data exploration.
Use markdown cells for documentation and code cells for execution.
Always restart and run all cells before sharing or saving to avoid confusion from out-of-order execution.
Notebooks are great for exploration, teaching, and prototyping, but not the best tool for large software projects or version-controlled pipelines.
Watch out for common pitfalls like hidden variables, confusing outputs, and version control issues.